Could you explain why there is almost a 7% difference between the growth of the S&P500 and the STX500 [Satrix S&P 500 Feeder ETF] this year, even though the latter is supposed to be tracking it?
The nearly 7% performance gap you’ve observed between the S&P 500 Index and its local tracking instrument, the Satrix S&P 500 Feeder ETF (exchange-traded fund), is a classic illustration of currency risk for South African investors.
The difference is almost entirely a function of the rand’s significant strengthening against the US dollar (USD) this year.
The local ETF (STX500) is performing its duty by tracking the S&P 500’s performance in USD. However, when those dollar gains are translated back into a stronger rand, the local return is dramatically reduced.
The currency calculation: The rand’s resilience
The S&P 500’s return is measured in its base currency, USD, while the local ETF’s return is measured in rand (ZAR).
- S&P 500 (USD) performance YTD: Based on general market commentary, the S&P 500 has posted a modest positive return year to date (as at late September) estimated at around 1.61% (excluding dividends for simplicity).
- Rand (ZAR) appreciation YTD: Over the same period, the South African rand has had a strong run:
- January 1: USD/ZAR: ≈ R18.82
- September 30: USD/ZAR: ≈ R17.28
This movement represents a decline in the USD/ZAR rate of approximately 8.19%.
This means that for every dollar your investment gained in the US, the dollar itself was worth 8.19% less in rand terms when you look at your portfolio statement.
The total return in rand is roughly calculated as:
ZAR return ≈ (1 + USD return ) × (1 + currency change) − 1
ZAR return ≈ (1 + 1.61%) × (1 − 8.19%) − 1
ZAR return ≈ (1.0161 × 0.9181) − 1
ZAR return ≈ 0.9330 − 1
ZAR return ≈ −6.7%
This mathematical calculation closely aligns with the nearly 7% difference (-6.70% vs +1.61%) you have observed, where the rand appreciation has effectively converted a positive US market return into a negative or negligible local return.
Visualising the rand’s strength
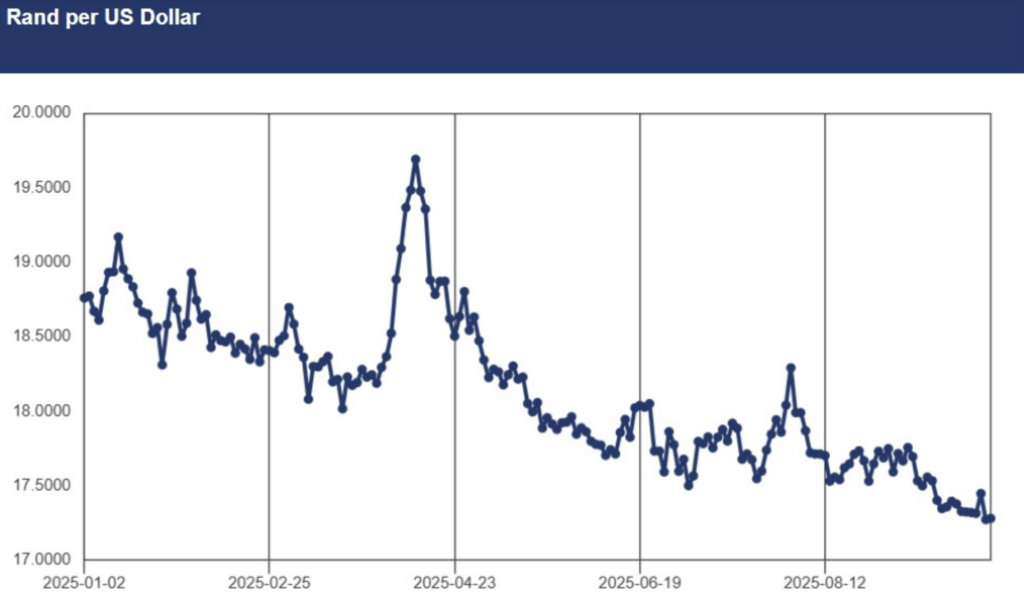
The following chart shows the movement of the dollar to the rand (USD/ZAR) from the beginning of 2025 until the end of September.
The falling line clearly illustrates the strengthening of the rand (rand appreciation) and the resulting drag on unhedged offshore investment returns.
Key takeaway for offshore investors
This scenario highlights the dual nature of unhedged offshore investing: you are placing two independent bets, one on the underlying asset’s performance and one on the currency movement.
While offshore investment is a vital tool for diversification, currency volatility ensures that the return reported on a US-based index will rarely match the ZAR return in a local ETF.
When the rand is strong, it acts as a significant headwind to your offshore returns.
Read: Choosing between S&P 500 market-cap and equal-weight ETFs: A strategic investor’s guide